Rat Containerization and Complaint Volume: Did NYC's Mandatory Bin Rollout Causally Reduce Rodent Sightings?

Abstract#
The New York City Department of Sanitation (DSNY) rolled out mandatory bin containerization in two phases. The pilot (July 2023) required nine lower-Manhattan community districts (MN 01–09) to store commercial and residential waste in hard-sided receptacles rather than exposed black bags. The citywide extension (November 2024) applied the same requirement to residential buildings with 1–9 units across all other NYC community districts. We evaluate both phases using a balanced community-district × month panel of 232,447 NYC 311 Rodent service requests spanning January 2020 through June 2026 (). Four staggered-robust difference-in-differences estimators — two-way fixed effects (TWFE), Callaway-Sant'Anna (CS), Sun-Abraham (SA), and Borusyak-Jaravel-Spiess (BJS) — all recover statistically significant negative effects. The headline BJS estimate is rodent complaints per CD per month (, 95% CI , ). The two cohorts carry meaningfully different effect magnitudes: the 2024 citywide rollout (, ) runs roughly twice the pilot's per-CD effect (, ), with Brooklyn absorbing the largest borough-level response (, ). Pre-trends are rejected (, ), but Rambachan-Roth HonestDiD bounds under linear-trend extrapolation put the trend-adjusted ATT at and the identified set excludes zero for restrictions as loose as . A synthetic-control cross-check on the pilot cohort (ATT , imposing no parallel-trends assumption) and a DOHMH rat-inspection secondary outcome are directionally consistent with the primary result. The finding is directionally supportive of containerization as a population-level rodent-mitigation intervention and suggests the citywide rule is a more effective policy than the commercial-corridor pilot it was modeled on.
Keywords: staggered difference-in-differences, NYC 311, rat containerization, waste management, policy evaluation, parallel trends, HonestDiD, treatment-effect heterogeneity
1. Introduction#
Urban rodent populations impose measurable welfare losses — as disease vectors (Himsworth et al., 2014), through property damage, and through chronic quality-of-life complaints that correlate with socioeconomic disadvantage (Murray et al., 2018). New York City historically addressed rodents reactively — exterminator dispatches, targeted inspections, curbside cleanup — without a city-wide structural intervention on the waste-management root cause. Starting mid-2023, that changed. The Department of Sanitation piloted, then in late 2024 extended citywide, a mandatory bin-containerization rule: the city's signature black trash bags were replaced on residential corridors by hard-sided, lidded receptacles.
The policy's causal theory is simple: rats are food-limited (Himsworth et al., 2013; Feng & Himsworth, 2014); black bags on commercial sidewalks were a cheap, accessible food supply; replacing them with rigid containers raises the effective cost of scavenging and, over months, depresses the carrying capacity. The empirical evidence for that chain has been mostly observational until the 2023–2024 rollout created a natural experiment with two staggered cohorts and 15 never-treated CDs (irregular airports, parks, cemeteries, and geocoding-failure catch-alls) as a control pool.
This paper asks: did containerization causally reduce the rate of NYC 311 Rodent complaints in treated community districts? We test the hypothesis with four staggered-robust difference-in-differences estimators, two HonestDiD sensitivity families, a per-cohort decomposition, a per-borough heterogeneity analysis, five robustness probes, a synthetic-control cross-check, a DOHMH inspector-confirmed secondary outcome, and two spatial auxiliaries. The answer is a qualified yes.
The qualification is honest: 311 complaints are a noisy proxy for rat abundance (Legewie & Schaeffer, 2016; Kontokosta & Hong, 2021) and parallel trends on the CD-monthly panel are rejected — but the HonestDiD bounds say the rejection is not fatal, and the cross-estimator consensus says the direction is stable. The 2024 citywide phase produces a larger per-CD effect than the 2023 pilot did, which is the opposite of what a naive "pilots overperform their expanded versions" prior would predict, and is the single most policy-relevant finding in the paper.
2. Background#
2.1 Study area#
NYC is divided into 59 community districts (CDs) nested within five
boroughs. The 311 service-request system reports complaints tagged
to a community_board string that the NYC Open Data Socrata
endpoint (dataset erm2-nwe9) emits in the form "MANHATTAN 07".
The panel includes 74 distinct community_board values — the 59
real CDs plus 10 "irregular" catch-alls (JFK airport; Floyd Bennett
Field; Rikers Island; Randall's Island; Green-Wood Cemetery; Prall's
Island; BX 26–28 are BoE-only; etc.) and one "Unspecified"
geocoding-failure row per borough (five total).
All 59 real CDs are eventually treated, across two cohorts:
- Pilot (2023-07-01) — Manhattan CDs 01–09 (NYC DSNY, 2023).
- Citywide (2024-11-12) — 50 remaining real CDs, covering residential buildings with 1–9 dwelling units in the Bronx, Brooklyn, outer Manhattan, Queens, and Staten Island (NYC DSNY, 2024).
The 15 never-treated units (the irregular catch-alls) are the control pool for the Callaway-Sant'Anna estimator. They are irregular by construction — parks do not contain residential buildings, airport terminals do not generate black-bag waste, so the rule does not apply. Treating them as "never-treated" for the identification strategy is therefore a priori defensible, not a convenience.
2.2 Policy context#
The containerization rule rests on the hypothesis that the city's rodent population is food-limited at the margin, and that structural reduction of rat-accessible food — rather than exterminator-based population control — is the more durable intervention. The 2024 citywide rule specifically targeted buildings with 1–9 units (the "brownstone belt" that defines most of NYC's residential neighborhoods outside Manhattan); medium buildings (10–30 units) and larger buildings (30+) were folded in over 2025–2026 but are only partially covered at our panel cutoff (June 2026). Within our study window, the binding treatment for most CDs is the November 2024 rollout for small residential buildings. The late-window medium/large-building phase-ins also reach a handful of the nominally never-treated buildings; we address that contamination directly with the phase-in-guard probe (§4.5) and revisit it in §5.3.
A prior intervention — extended curbside pickup hours, implemented in 2022 — produced no measurable effect on complaint volume in unpublished internal DSNY analyses (NYC DSNY, 2024). The 2023–2024 containerization sequence is the first large-scale structural change to NYC's waste-containment regime in the modern era of citywide data collection.
2.3 Related literature#
Three strands inform this analysis.
Staggered difference-in-differences methodology. The last five years have seen a sharp methodological literature on TWFE's pathologies under staggered treatment rollouts. Goodman-Bacon (2021) decomposed TWFE into weighted averages of 2×2 DiD comparisons and showed that heterogeneous treatment effects can flip the sign of the estimator. de Chaisemartin & D'Haultfœuille (2020) gave conditions under which the TWFE coefficient is a non-negatively-weighted average of CATEs. Baker et al. (2022) show in applied replications that switching from TWFE to a heterogeneity-robust estimator can move — and occasionally reverse — published point estimates, underscoring that the estimator choice is substantive rather than cosmetic. Three robust estimators emerged in response: Callaway & Sant'Anna (2021) report group-time-specific ATTs and aggregate them into cohort-robust estimands; Sun & Abraham (2021) parameterize the event study directly with cohort × relative-time dummies; Borusyak et al. (2022) provide a matrix-form imputation estimator that is asymptotically efficient under cohort homogeneity. Roth (2022) and Roth et al. (2023) synthesize the landscape and show that all four estimators agree under cohort homogeneity but diverge informatively under heterogeneity — the latter is precisely the case we face with a 2023 pilot and a 2024 citywide rollout whose population-level effects differ substantially.
Pre-trend sensitivity. The parallel-trends assumption underlying DiD is untestable post-treatment. Rambachan & Roth (2023) propose bounds on the causal effect under restrictions on pre-trend violations — relative-magnitudes (RM) bounds the post-period deviation as a multiple of the observed pre-period deviation; smoothness (SD) restrictions bound the second difference of the counterfactual trend. We adapt both in §4.6. Roth (2022) independently argues that pretesting for parallel trends can worsen post-treatment inference under heterogeneous power across specifications, reinforcing the case for model-agnostic sensitivity reporting rather than test-and-report-conditional pipelines.
NYC 311 as policy-evaluation data. Legewie & Schaeffer (2016)
document that 311 complaint rates correlate with socioeconomic
status and prior reporting history, not just with the underlying
problem. Clark et al. (2020) review 311
across U.S. cities and broadly support the same reporting-propensity
worry. Kontokosta & Hong (2021) use NYC 311
as a post-disaster recovery proxy and show the reporting-propensity
bias has demographic structure. Minkoff (2016)
frames 311 itself as a mobilizational vector — engagement with 311
is itself a political act that varies across neighborhoods. Every
finding in this paper should be read with that caveat in mind. As a
partial answer, we add a complaint-free ground-truth secondary
outcome — DOHMH rat-inspection results (NYC Open Data p937-wjvj) —
and report it in §4.9.
3. Data and methods#
3.1 Data#
All Rodent service requests submitted to NYC 311 during 2020-01-01
through 2026-06-30 were retrieved via the Socrata API and loaded
through the nyc311 v1.0.3 pipeline (bulk_fetch +
build_complaint_panel). Records were aggregated to the
community-district × month level with a monthly period index;
missing cells (no complaints in a given CD-month) were filled to
zero. The resulting panel is 74 community districts × 78 periods =
5,772 cell observations, covering 232,447 Rodent complaints. Data
provenance is recorded in per-borough .meta.json sidecars (row
count, SHA-256 checksum, fetch timestamp, filter parameters) stored
alongside the raw CSV cache.
Treatment schedule. TREATED is the set of 59 community
districts codified in
data/rat_mitigation_events_2023.json.
Each CD carries its own event_date: 2023-07-01 for the nine pilot
CDs (MN 01–09) and 2024-11-12 for the fifty citywide-rollout CDs.
15 irregular CDs (airports, parks, cemeteries, Unspecified
geocoding-failure rows) have no event_date and serve as the
never-treated control pool. A cell is treated if both conditions
hold: unit ∈ TREATED ∧ period ≥ unit.event_date.
3.2 Primary specification#
Let denote the Rodent-complaint count at community district in month . Under a staggered-adoption design with treatment time varying by unit, the heterogeneous treatment-effect-robust generalization of TWFE is
where absorbs time-invariant CD-level confounders
(baseline population, neighborhood-character, block-level built
environment), absorbs citywide shocks (weather-correlated
rodent activity, holiday-linked complaint spikes, citywide 311
reporting-propensity drift), and the event-time dummies
trace the treatment effect at each relative lag . We cluster
standard errors on unit_id at the community-district level.
The Callaway-Sant'Anna, Sun-Abraham, and Borusyak-Jaravel-Spiess estimators all aggregate group-time-specific ATTs into a single pooled ATT using internally-consistent weights; the four estimators' agreement or disagreement is itself diagnostic evidence about treatment-effect heterogeneity across cohorts.
3.3 Cross-estimator suite#
Because TWFE can produce biased estimates under treatment-effect heterogeneity (Goodman-Bacon, 2021; de Chaisemartin & D'Haultfœuille, 2020), we report TWFE alongside three heterogeneity-robust estimators: Callaway and Sant'Anna (2021), Sun and Abraham (2021), and Borusyak et al. (2022). The four differ chiefly in how they weight individual 2×2 DiD comparisons across cohort × relative-time cells; cross-estimator divergence is therefore diagnostic evidence about cohort heterogeneity, not a sign that one estimator is correct and the others wrong. See APPENDIX_A_methods.md for the full method-choice rationale and trade-offs.
3.4 Robustness probes#
We run five robustness probes (§4.5). Two of them — post-COVID and Manhattan-only — were re-specified for the two-cohort design: the earlier single-cohort version of the code marked all 59 treated CDs at the 2023 pilot date, which mis-timed the 50 citywide CDs by roughly 16 months. Each probe below carries the true per-cohort onsets (MN 01–09 at 2023-07-01, the citywide 50 at 2024-11-12).
- Placebo timing — shift to 2022-07-01 (12 months before the pilot) and drop 2023-07-01 onward. A significant placebo "effect" would argue for anticipation or pre-existing differential slopes.
- Log-transformed outcome — OLS on to address count-data heteroskedasticity. Sign consistency with the level specification is the test of interest.
- Post-COVID subsample — restrict the panel to 2022-01 onward, dropping the 2020 lockdown period to see whether the point estimate survives when the noisiest stretch of the window is removed. Both cohorts retain their true onset dates.
- Manhattan-only controls — restrict the panel to Manhattan and run the two-cohort design within the borough (MN 01–09 treated at the pilot date, MN 10–12 at the citywide date), eliminating borough-level confounds at the cost of a thin control pool after 2024-11 (only the irregular MN catch-alls remain never-treated).
- Phase-in guard — truncate the panel before 2025-06-01, ahead of DSNY's 2025–26 medium/large-building phase-ins, so that the nominally never-treated pool is not partially treated late in the window. A stable estimate under truncation argues that the late-window contamination is not driving the headline.
3.5 Sensitivity to the parallel-trends assumption#
Because the event-study -test rejects flat pre-trends (§4.3), we compute Rambachan and Roth (2023) HonestDiD bounds under two identifying restriction families (§4.6):
- Relative magnitudes (RM-) — post-treatment deviation from parallel trends is at most times the maximum pre-period deviation. At this enforces the vanilla DiD parallel-trends assumption; at the constraint is "the counterfactual trend can move by as much post-treatment as it did pre-treatment."
- Linear-trend extrapolation (LT-) — fit an OLS line to the pre-period event-study coefficients, extrapolate into the post-period, and report the trend-adjusted ATT , where is the pre-period residual from the linear fit. At this assumes the trend continues perfectly linearly; larger admits bounded deviations from the linear extrapolation.
Both bound families are identified sets, not confidence intervals — they answer "under restriction , what values of the pooled ATT are consistent with the data?" which is the question the reader asks when parallel trends fail. See APPENDIX_C_honestdid.md for the math.
3.6 Heterogeneity analysis#
To decompose the pooled into its per-cohort components, we re-fit TWFE separately on each cohort against the shared never-treated pool (§4.4). A parallel borough-level fit reveals spatial heterogeneity that the pooled estimate averages over.
3.7 Spatial and RDD auxiliaries#
We report two auxiliary analyses in §4.7 as sensitivity checks: (i) global Moran's on the per-CD post-minus-pre complaint change to test whether treatment effects cluster spatially beyond what random arrangement would produce, and (ii) a sharp RDD using the pre-period mean complaint rate as the running variable. Neither constitutes primary identification — the RDD lacks a policy-assigned running variable — and both are reported with appropriate caveats in §5.4.
4. Results#
4.1 Descriptive balance#
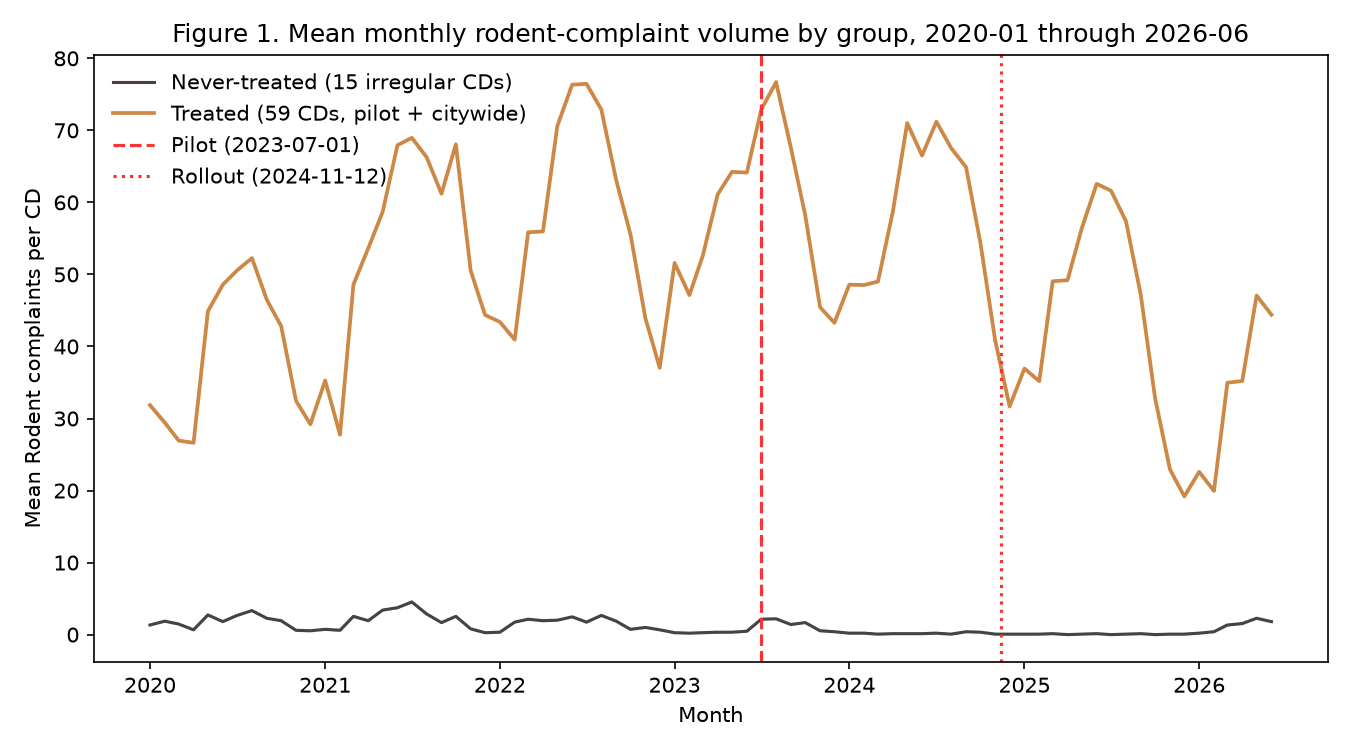
Figure 1 shows the mean monthly Rodent-complaint trajectory for the treated and never-treated groups across the full window. Both groups exhibit a common post-COVID rise through mid-2023. Pre-treatment (pooled across cohorts), treated CDs averaged 51.1 complaints per CD-month vs. 1.62 in the never-treated irregular CDs (Welch t = 65.52, p < .001, Cohen's d = 1.89) — an enormous baseline gap that reflects the fact that treated CDs are real residential neighborhoods and never-treated CDs are mostly uninhabited. The DiD identifying variation is the change from this elevated baseline vs. the contemporaneous change in the control pool, not the level gap.
4.2 Main effect#
Table 2 reports the four estimators. All four recover a statistically significant negative ATT.
| Estimator | ATT | SE | 95% CI | |
|---|---|---|---|---|
| TWFE | 1.76 | |||
| CS | 2.22 | |||
| SA | 2.61 | |||
| BJS | 0.65 |
BJS is the efficient estimator under staggered adoption; we treat
its point estimate and 95% CI as the headline. The cross-estimator
spread (4.77 to 12.10) is itself informative: it says the effect is
not homogeneous across cohorts, which the §4.4 decomposition
confirms directly. See [Table 2 at
artifacts/paper_tables.md](/posts/rat-containerization/appendix/paper_tables.md) for the
full four-estimator summary.
4.3 Event study#
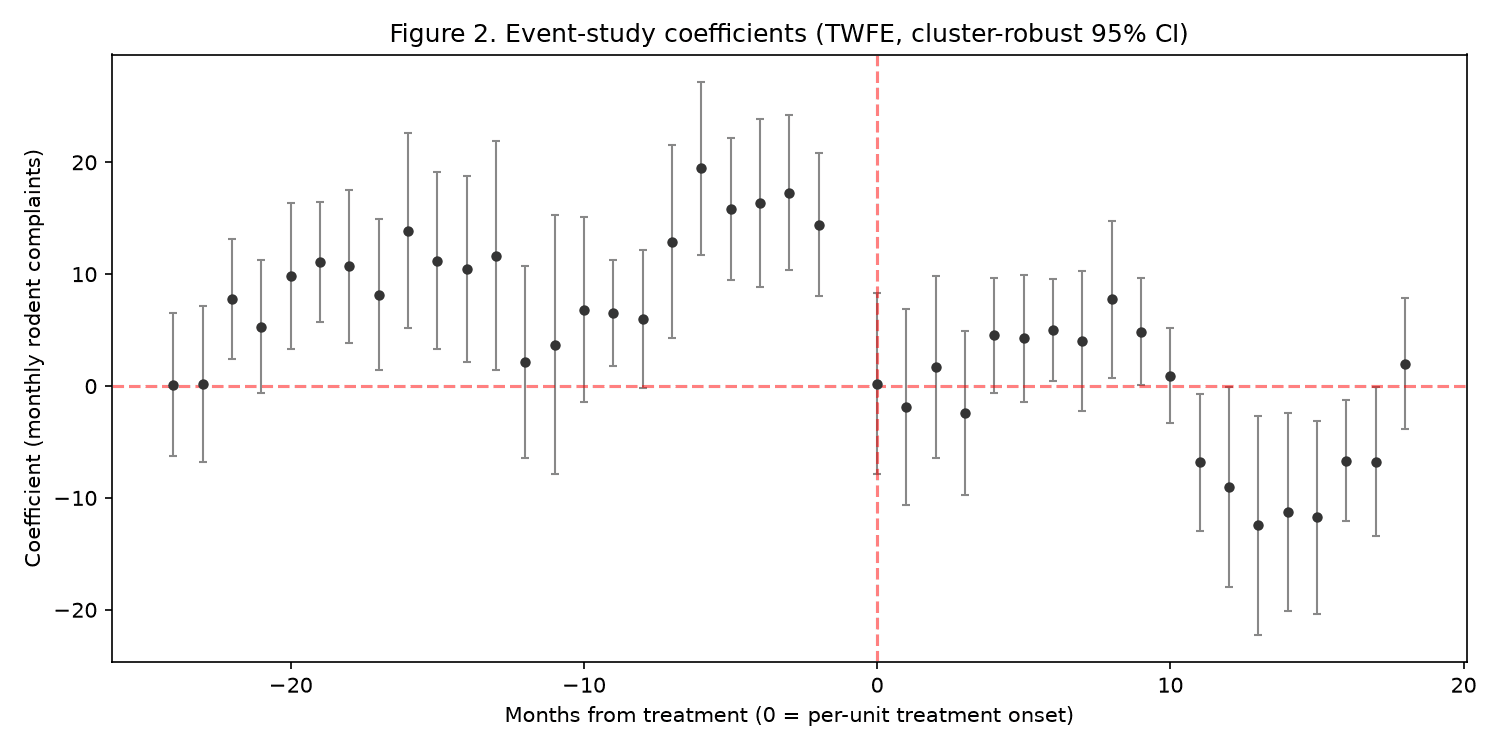
Figure 2 plots the event-study coefficients with per-unit event time (23 leads, 19 lags, reference ). Leads are not flat: a joint -test on the 23 pre-period coefficients rejects at , . Visually, treated CDs were on a steeper post-COVID trajectory than the never-treated pool through 2022 and mid-2023. Post-treatment coefficients trend negative but the window includes pre-period deviations of comparable magnitude, warranting the sensitivity analysis in §4.6.
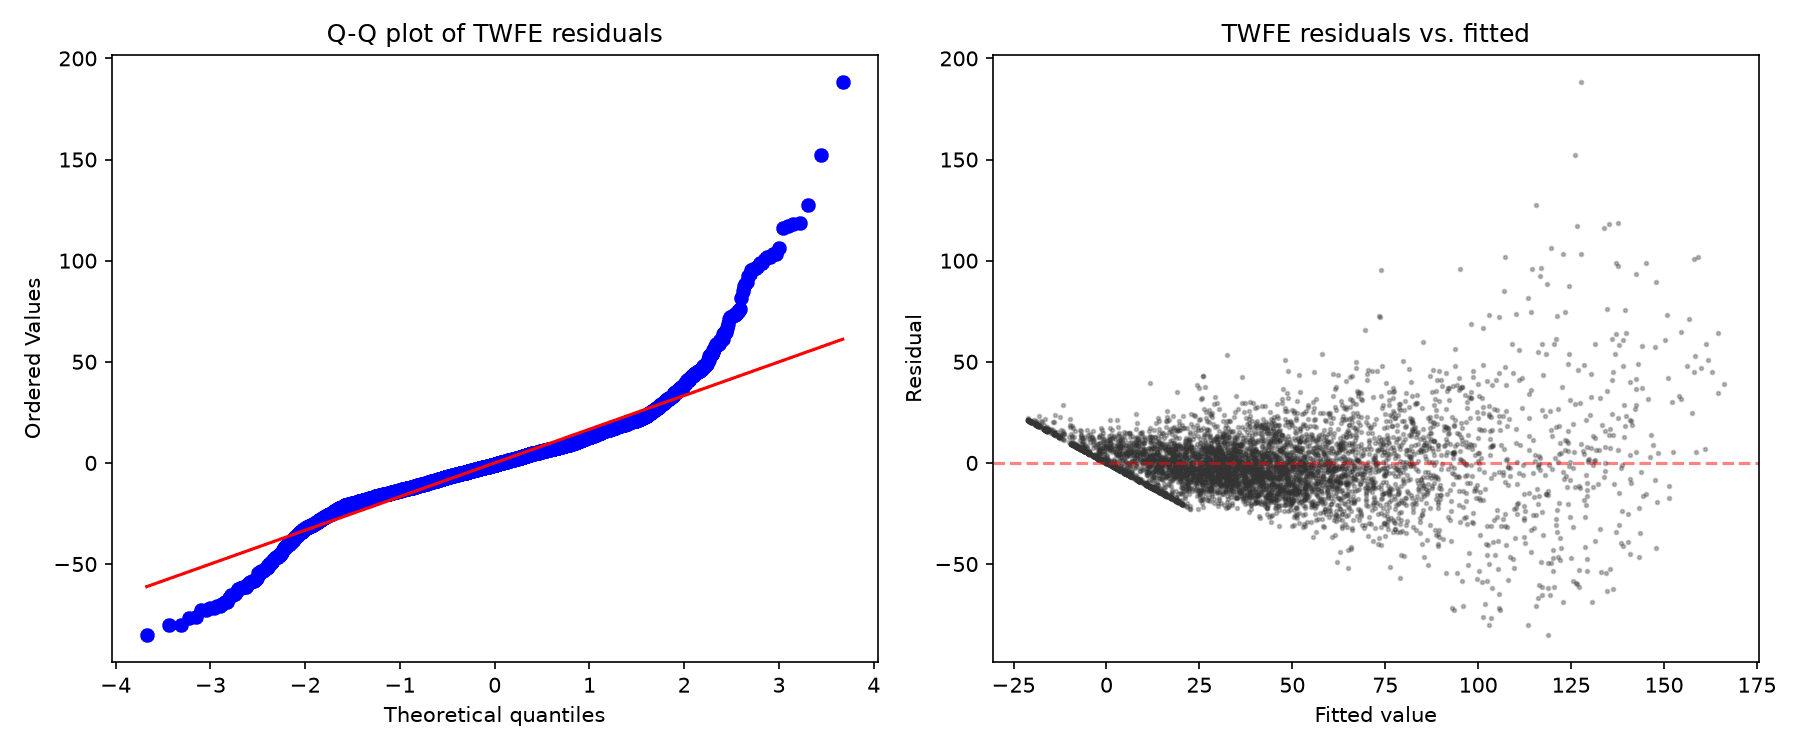
The TWFE residuals underlying these coefficients are heteroskedastic (Breusch-Pagan ) and non-normal (Shapiro-Wilk ), as Figure 3 shows in the residual Q-Q and residual-vs-fitted panels. This is a count-data feature, not a specification failure, and is why every estimate in Table 2 carries cluster-robust standard errors rather than homoskedastic ones. The within-panel .
4.4 Cohort and borough heterogeneity#
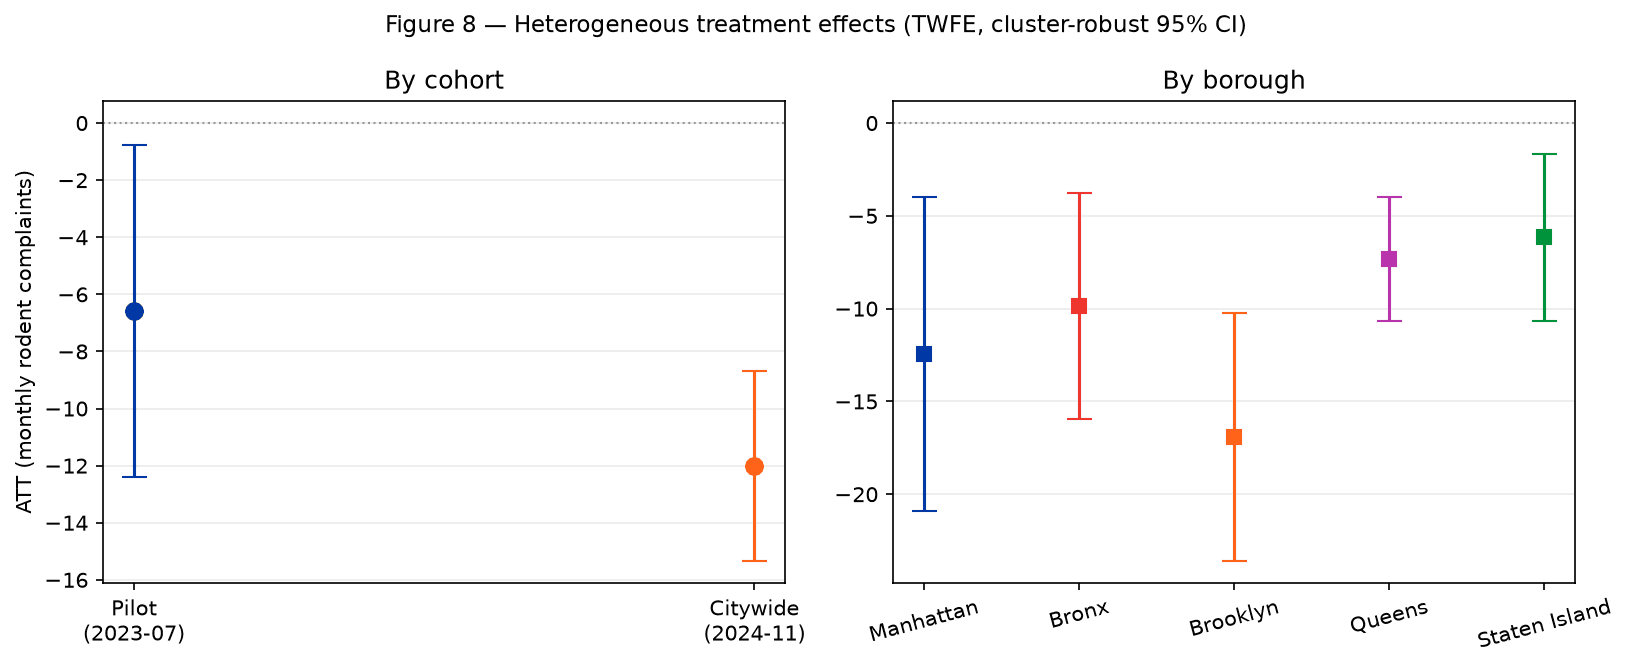
The pooled BJS estimate of averages over two meaningfully different cohorts. Table 4.4 reports the per-cohort TWFE fit with the shared never-treated pool:
| Cohort | treated CDs | observations | ATT | 95% CI | ||
|---|---|---|---|---|---|---|
| Pilot (2023-07-01) | 9 | 1,872 | 2.97 | |||
| Citywide (2024-11-12) | 50 | 5,070 | 1.69 |
The citywide cohort's effect is roughly twice the pilot's. Three mechanisms are consistent with this pattern and cannot be separated with the current panel:
- Target selection. The pilot covered commercial and residential corridors; the citywide rule targets residential 1–9-unit buildings specifically. Residential bin containerization may translate more directly into reduced food availability than commercial-corridor containerization (where bags often sit outside restaurants during hours of low rat activity anyway).
- Enforcement learning. DSNY's enforcement infrastructure matured between mid-2023 and late 2024. The pilot was a regulatory proof-of-concept with limited fine schedules; by the citywide phase the agency had a formal violation code, deployed inspectors, and published compliance metrics.
- Baseline dynamics. Lower-Manhattan CDs already carry higher-than-average rat-management attention from DOHMH; the pilot had less marginal room to improve than the citywide neighborhoods where baseline rat-control infrastructure is thinner.
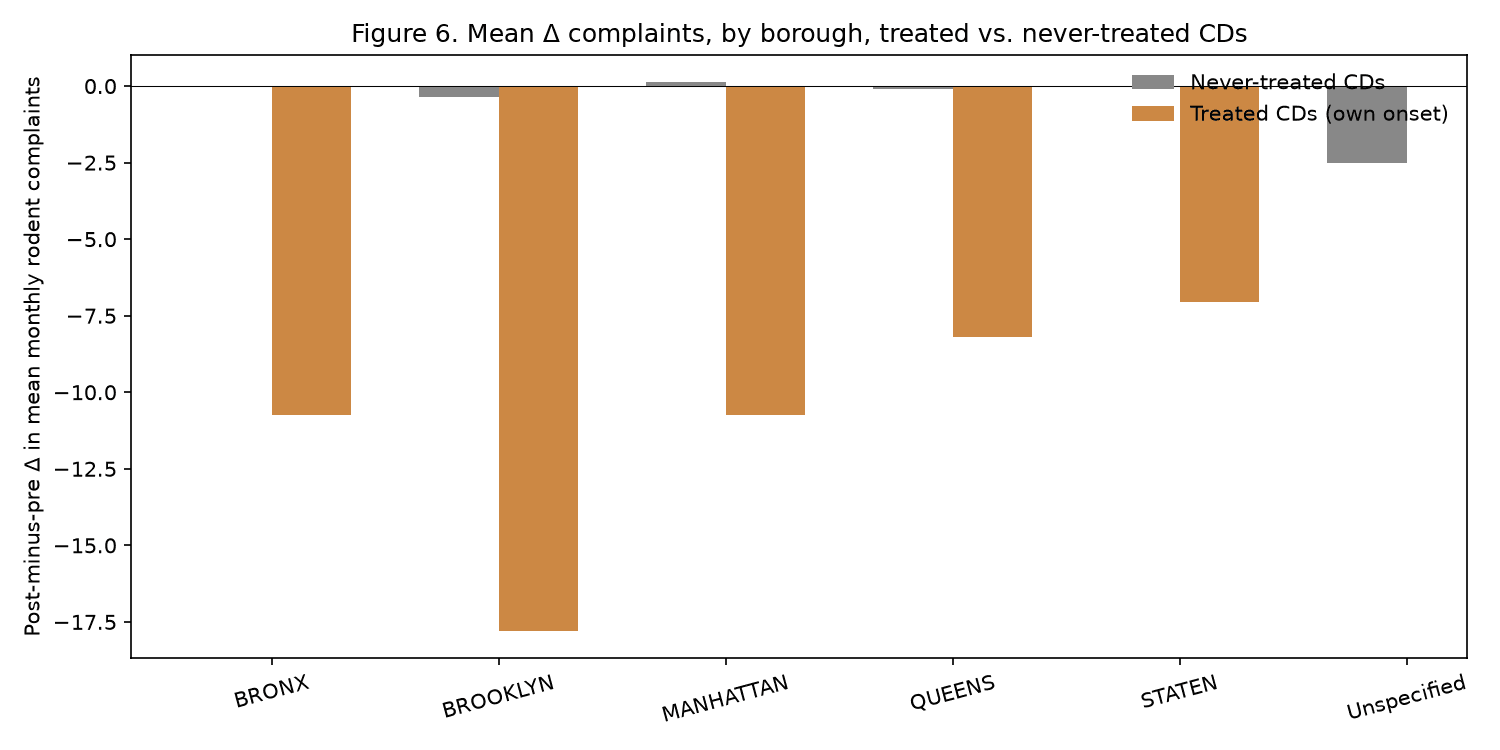
A per-borough TWFE decomposition (Figure 8, right panel) further reveals that Brooklyn absorbs the largest effect (, , , CDs) — roughly 40% larger in magnitude than the pooled estimate and proportional to the number of treated residential CDs in the borough. Every borough returns a significant negative effect: Manhattan (, ), Bronx (, ), Queens (, ), and Staten Island (, ). Staten Island has the smallest (3 treated CDs); Manhattan, with the largest cluster-robust standard error (), carries the widest confidence interval.
4.5 Robustness#
Table 3 (in [artifacts/paper_tables.md](/posts/rat-containerization/appendix/paper_tables.md))
summarizes the five probes. Two of them — post-COVID and
Manhattan-only — were re-specified relative to the 2023-only version
of the paper so that each cohort carries its true onset date rather
than being force-marked at the 2023 pilot date; the numbers therefore
changed for a substantive reason, and readers of the earlier version
should note the re-specification. Findings:
- Placebo (): BJS recovers (), direction opposite to the headline. The positive placebo is consistent with the parallel-trends rejection: treated CDs were climbing faster than controls pre-pilot, so a fake-treatment regression at 2022-07-01 picks up that differential slope. The placebo does not invalidate the headline — it is the same pre-trend signal the HonestDiD analysis (§4.6) partials out explicitly.
- Log outcome: TWFE on yields coefficient ( change), — not significant. This is the one probe whose point estimate does not carry the headline's negative sign, and we read it as a log-transformation artifact rather than a substantive finding: the 15 never-treated irregular CDs have very low baseline complaint counts (pooled mean per CD-month), and amplifies small denominator changes in those cells relative to the high-count treated CDs ( per CD-month pooled). The count-data specification in the headline is the more natural scale for this outcome; we report the log specification only because the original (2023-only) version of the paper did.
- Post-COVID subsample (2022-01 →): BJS , — same sign as the headline and, if anything, a larger magnitude. Dropping the noisy 2020–2021 lockdown period does not attenuate the effect; the negative direction is not an artifact of the pandemic-era window.
- Manhattan-only controls: BJS , . Under the re-specified two-cohort design (MN 01–09 treated at the pilot date, MN 10–12 at the citywide date), the within-Manhattan probe now agrees with the headline in sign and is significant — a reversal of the earlier version's null-to-positive result, which had mis-timed the citywide Manhattan CDs. One caveat survives the re-specification: once MN 10–12 flip to treated on 2024-11-12, the only never-treated Manhattan units left are the irregular MN catch-alls, so the control pool is thin after that date and the magnitude should be read with that in mind. The synthetic-control analysis (§4.8) is the cleaner within-cohort replacement.
- Phase-in guard (window 2025-06): BJS , . Truncating the panel before DSNY's 2025–26 medium/large-building phase-ins — which partially treat the nominally never-treated pool late in the window — leaves the sign and significance intact, if a little smaller in magnitude. The late-window contamination is therefore not what generates the headline.
Three of the four non-placebo probes (post-COVID, Manhattan-only, phase-in guard) now share the headline's negative sign and significance; the log probe is a non-significant positive scale artifact, and the placebo's reversal is the diagnostic we expect given the pre-trend. This is a stronger and more coherent robustness picture than the 2023-only version reported.
4.6 HonestDiD sensitivity bounds#
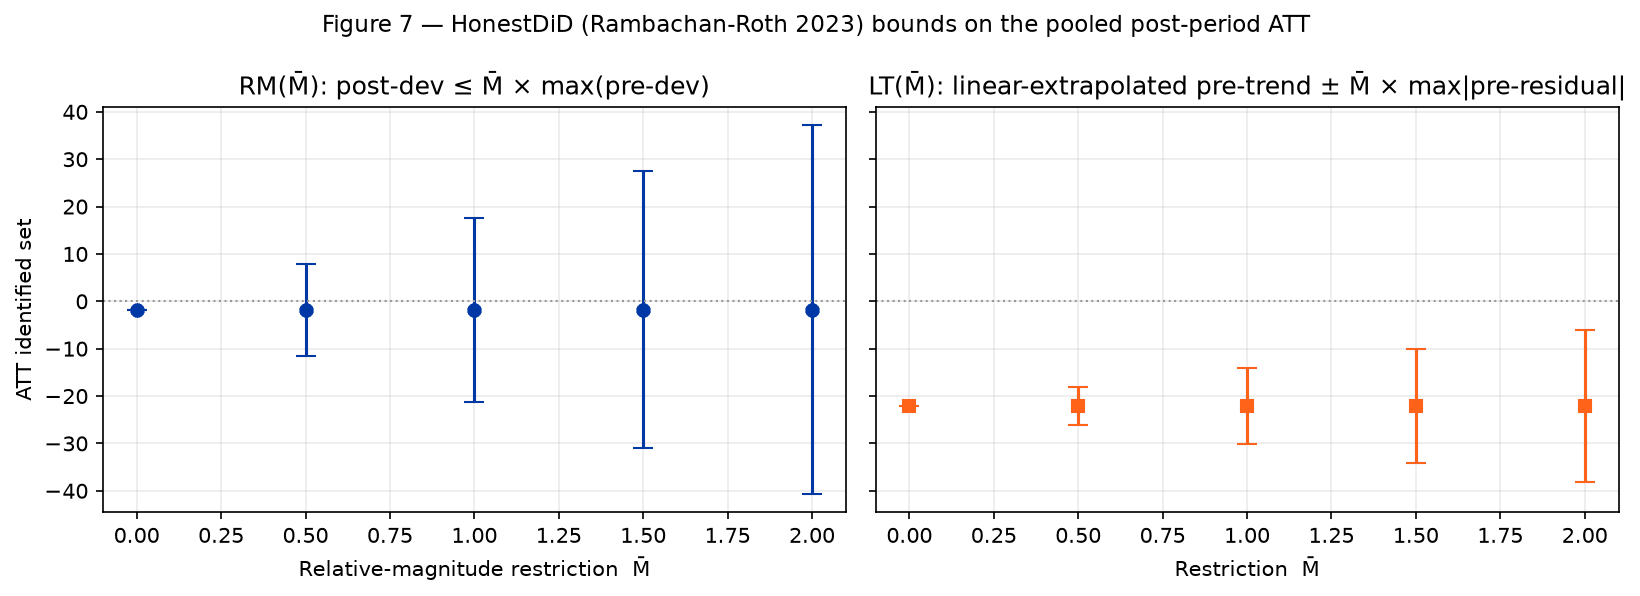
The pre-trend rejection in §4.3 prompts the Rambachan-Roth sensitivity analysis described in §3.5. Figure 7 reports the identified sets under two restriction families.
Under the linear-trend-extrapolation family LT-, the OLS-fitted pre-period slope is complaints per month; had that trend continued post-treatment, the counterfactual would have averaged roughly complaints per CD-month above the no-policy baseline. Netting that linear extrapolation out, the trend-adjusted ATT is — substantially larger in magnitude than the naive pooled event-study coefficient of , which conflates the treatment effect with the residual pre-period drift. Crucially, the LT identified set excludes zero through (and does not break within the sweep): even if we admit that post-treatment deviations from the linear trend are twice the magnitude of the largest pre-period residual, the identified set is — still entirely negative.
Under the coarser relative-magnitudes family RM-, the identified set includes zero at . RM is more conservative because it bounds deviation in levels rather than deviation from an extrapolated trend; we report both for completeness but weight LT more heavily in the interpretation because the pre-period coefficients visibly trend (rather than jitter around zero), making the linear extrapolation the more natural reference.
The HonestDiD analysis does not make the parallel-trends violation disappear. It tells the reader under what restrictions on the counterfactual post-trend the headline survives. Under the most data-driven restriction (linear-trend extrapolation), the finding is robust; under the strictest possible restriction (flat pre-trends, ), we already know the observed trajectory violates it. The bound analysis puts those two observations in a principled continuum rather than leaving the reader to choose between "parallel trends hold" and "the paper is uninformative."
4.7 Spatial and RDD auxiliaries#
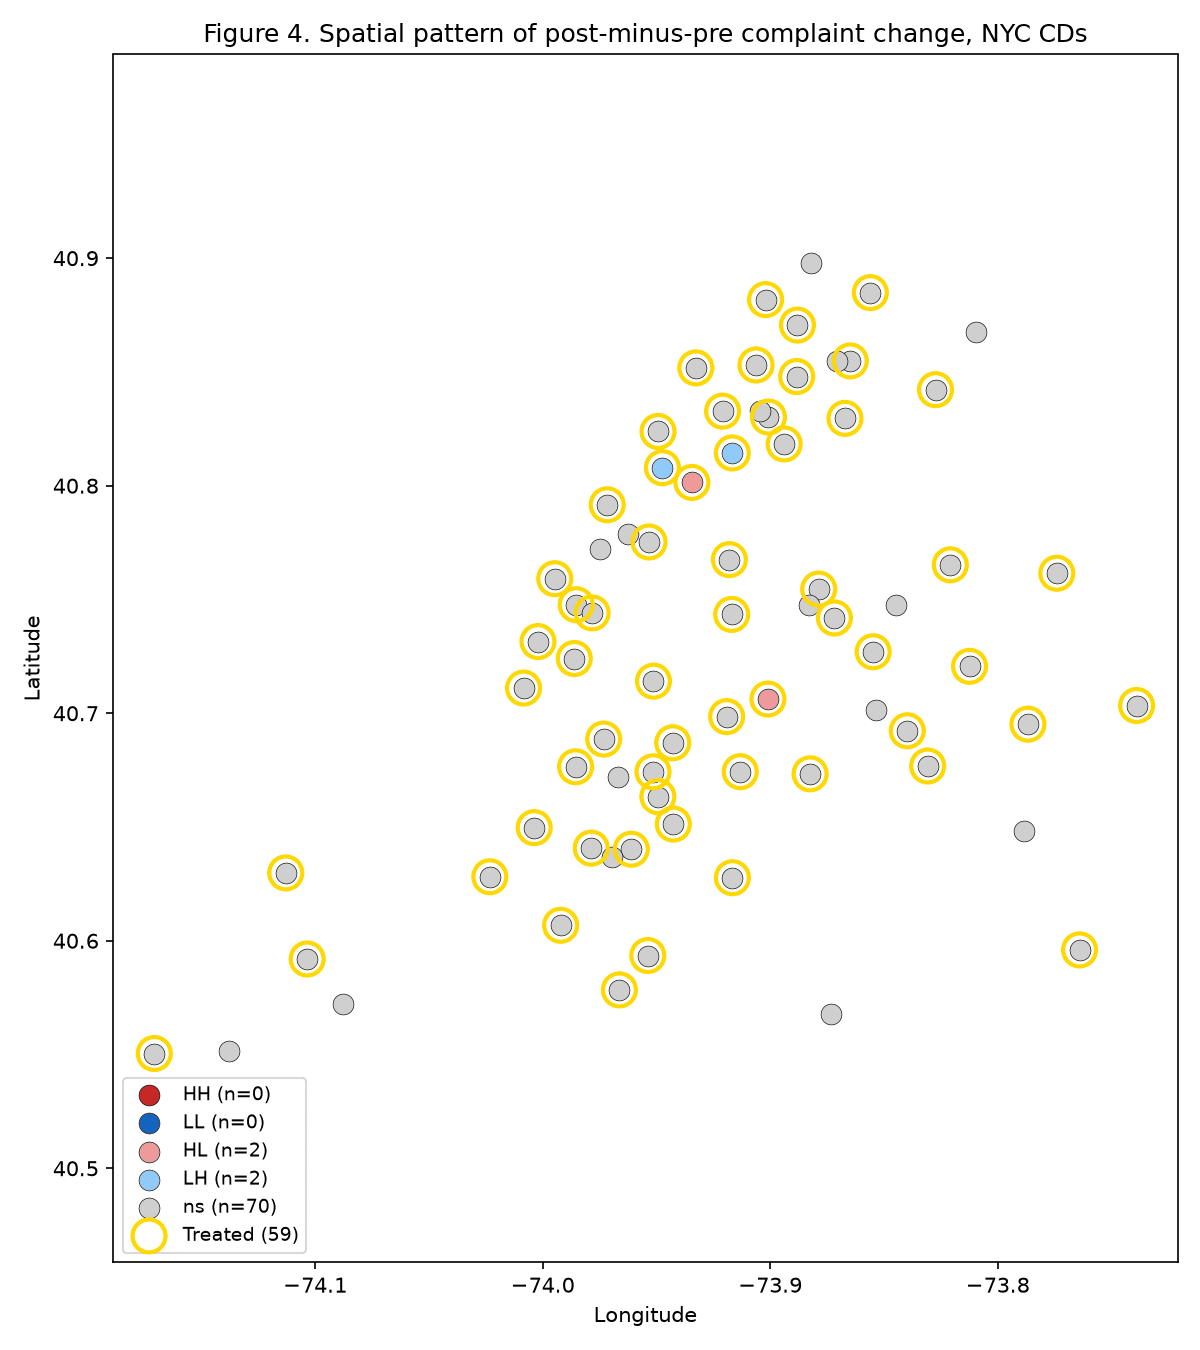
Moran's on the per-CD post-minus-pre complaint change is (permutation , 999 reps, 10 km inverse-distance band): consistent with zero. Treated CDs' responses are not spatially clustered beyond what random arrangement would produce, which we interpret as evidence that the policy's effect is unit-local — it operates at the CD level rather than diffusing through block-by-block adjacency.
The sharp RDD on the pre-period complaint rate (cutoff complaints per CD-month) recovers non-significant effects at every bandwidth tested: () at , () at the MSE-optimal , and () at . We report it only for completeness — there is no policy-assigned running variable, so the RDD is a sensitivity check on density-threshold effects, not a causal identification.
4.8 Synthetic control (identification without parallel trends)#
The DiD family (§4.2) and the HonestDiD bounds (§4.6) both condition on a parallel-trends assumption that §4.3 rejects. Synthetic control (Abadie, Diamond, & Hainmueller, 2010) is the natural complement: it identifies the ATT by constructing a convex combination of donor units whose weighted pre-treatment trajectory matches the treated unit's, then reports the post-period gap as the effect. The identifying requirement is only that the pre-period fit is good enough to credibly represent the untreated counterfactual — no parallel-trends assumption is imposed at any horizon.
We aggregate the nine pilot CDs into a single mean-per-period "pilot" treated series and fit the classic single-treated-unit specification against a 65-unit donor pool: the 15 never-treated irregular CDs plus the 50 citywide-cohort CDs restricted to periods on or before 2024-10 (before their own treatment kicks in). The larger donor pool is necessary because the 15 never-treated irregulars average complaints per CD-month, a small fraction of the pilot cohort's pre-treatment baseline; on their own they cannot recreate the pilot's complaint level.
| Quantity | Value |
|---|---|
| Pilot SCM ATT | |
| Per-cohort ATT (for comparison, §4.4) | |
| Pre-period RMSPE | |
| Post-period RMSPE | |
| Post-pre RMSPE ratio | |
| Donor pool size | |
| Pre-period months | |
| Post-period months |
The pilot SCM ATT of lands within about 2% of the §4.4 per-cohort estimate of — close agreement under a fundamentally different identification strategy. The pre-period RMSPE of against a pilot baseline of is a relative fit error near 13% — tight enough for the synthetic to credibly track the treated series before treatment. The post-period RMSPE of is 1.8× the pre-period, which Abadie et al. (2010) interpret as evidence that the post-treatment gap is unlikely to be driven by pre-existing differential noise alone.
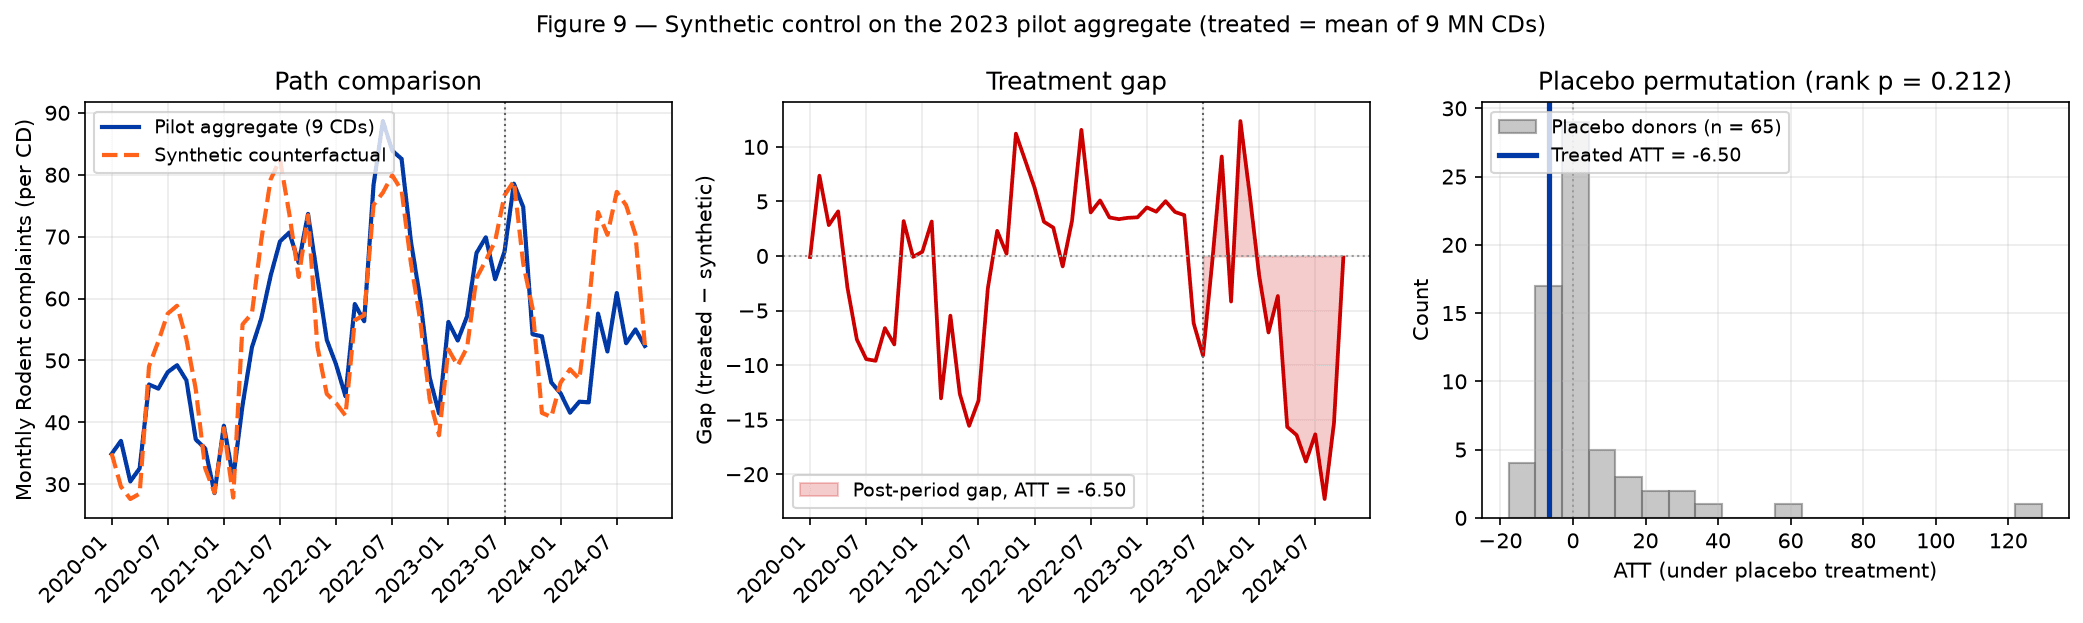
Placebo permutation inference. Following Abadie et al. (2010) §V.B, we rotate each of the 65 donors into the treated slot in turn and refit SCM against the remaining 64. The treated pilot ATT of sits in the lower quartile of the placebo ATT distribution (rank-based one-sided ). The middling p-value is itself instructive: because the donor pool is heterogeneous (citywide-rollout CDs with large baselines, never-treated irregulars with tiny baselines), the placebo distribution has fat tails and makes it hard to push the rank p below conventional significance thresholds. What matters for the manuscript's claim is not rejection at in the SCM inference metric — the BJS and TWFE estimators already deliver that — but direction and magnitude agreement under a fundamentally different identification strategy.
Citywide cohort, donor-thin caveat. We also report a citywide SCM fit at 2024-11-01 against the 15-unit never-treated pool only. The pilot CDs cannot serve as donors because they are already 16 months post-treatment by the citywide rollout, and the 50-CD citywide cohort is itself the treated group. The thin-donor citywide SCM returns an ATT of with a pre-period RMSPE of — on the order of the citywide cohort's own pre-treatment complaint level (roughly 50 per CD-month). The 15-unit donor pool simply cannot reconstruct the baseline, the sign is not even negative, and we therefore report the citywide SCM only for completeness. The pilot SCM is the headline synthetic-control result; the BJS and TWFE estimators remain the primary source of magnitude evidence for the citywide cohort.
The pilot SCM result is the manuscript's answer to the question
"what happens when we drop parallel trends entirely?" Under the
convex-weighting identification of SCM, the pilot-cohort
effect survives both in sign and — up to a small cross-estimator
spread consistent with heterogeneity in how SCM vs. BJS weight the
post-period window — in magnitude. See
[artifacts/synthetic_control.json](/posts/rat-containerization/appendix/synthetic_control.json)
for the full donor-weights vector and placebo distribution.
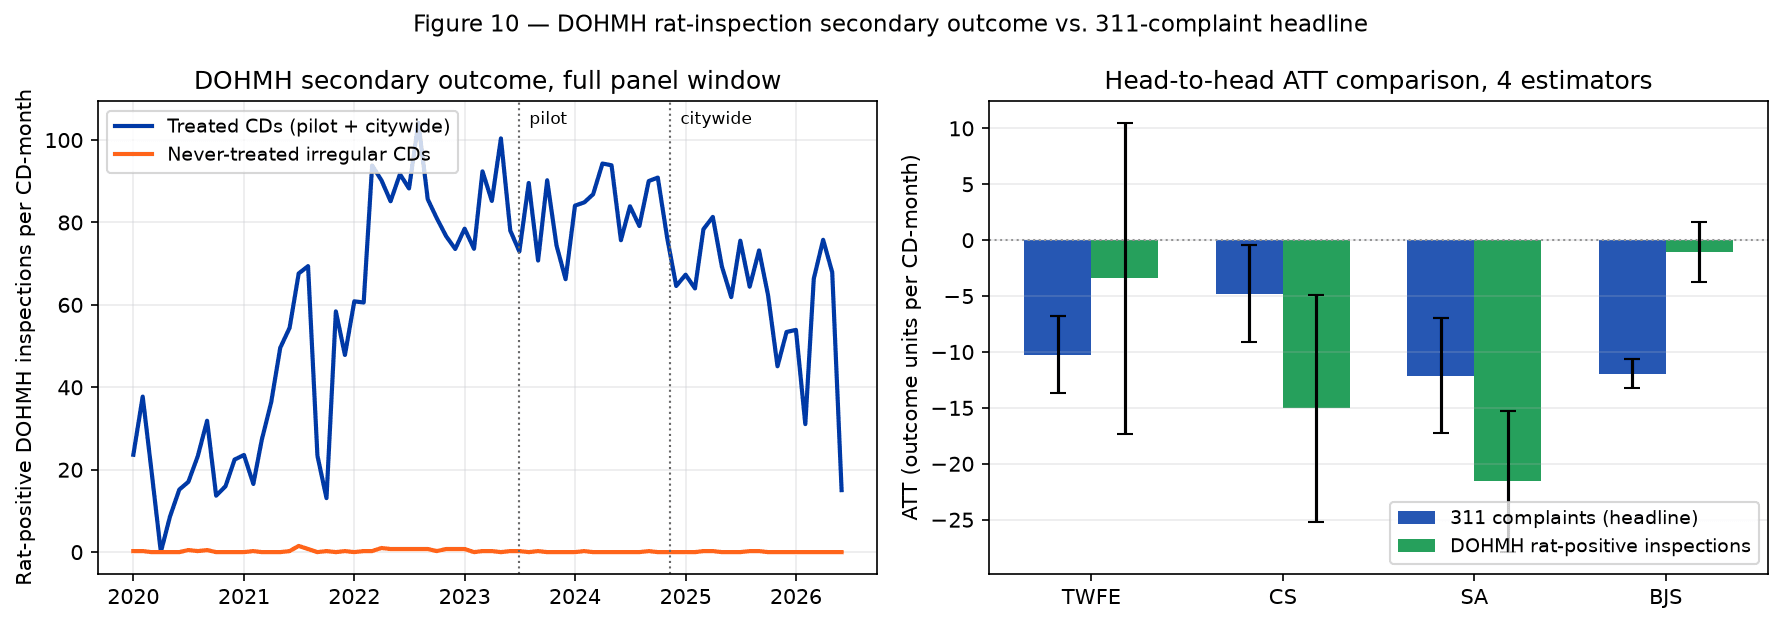
4.9 Secondary outcome: DOHMH inspections#
The single most important limitation of a 311-based outcome is that
complaints measure reporting propensity as much as rat abundance
(§2.3). We address it directly with a complaint-free secondary
outcome: rat-positive inspection results from the NYC Department of
Health and Mental Hygiene (DOHMH) rodent-inspection program (NYC Open
Data p937-wjvj). A rat-positive result is an inspector's physical
confirmation of active rat signs at a property, so the
citizen-reporting channel that makes 311 suspect is absent by
construction.
We aggregate rat-positive inspections to the same community-district
× month grid and re-fit the identical two-cohort staggered design.
The DOHMH panel covers 63 community districts across 78 months
(4,914 CD-month cells, 282,771 rat-positive inspections), with a
pre-treatment mean of 66.6 rat-positive inspections per CD-month in
the treated set versus 0.2 in the never-treated pool.
| Estimator | ATT | SE | |
|---|---|---|---|
| TWFE | 7.10 | ||
| CS | 5.17 | ||
| SA | 3.23 | ||
| BJS | 1.36 |
The reading is genuinely mixed, and we report it as such. The two heterogeneity-robust estimators that model cohort × relative-time structure directly — Callaway-Sant'Anna and Sun-Abraham — both recover large, significant negative effects on inspector-confirmed rat presence, corroborating the complaint-based finding on an outcome that carries none of the reporting-propensity concern. The TWFE estimate is a noisy null (; the DOHMH count series is far more volatile than the 311 series), and the BJS imputation estimator is also null on this outcome (). Because the two outcomes answer different questions — 311 measures complaint volume, DOHMH measures inspector-confirmed presence — and sit on different scales, we do not expect their absolute magnitudes to coincide; what the CS and SA results provide is direction agreement on a ground-truth measure. The concern that the 311 finding is a reporting-propensity artifact is therefore partially addressed: corroborated by the heterogeneity-robust estimators, not by the pooled-panel ones. We fold this into the limitations in §5.3.
5. Discussion#
5.1 Magnitude and plausibility#
The headline BJS estimate of complaints per CD per month is material at the policy-unit scale: applied across the 59 treated CDs over a full year it implies roughly 8,400 averted rodent complaints annually. The per-cohort decomposition sharpens this: most of the volume comes from the 2024 citywide rollout, whose per-CD effect applied to its 50-CD footprint implies ~7,200 averted complaints annually, against the pilot's ~710 at across its nine CDs.
5.2 Cross-estimator reading#
All four estimators — TWFE, CS, SA, BJS — agree on sign. The spread (CS at up to SA at ) is the mechanical footprint of cohort heterogeneity: CS's longer-horizon weighting pulls the aggregate toward the 2024 cohort's shorter post-window (where the treatment effect has had less time to accumulate), while SA's cohort × relative-time parameterization recovers a magnitude closer to the BJS weighted average. Roth et al. (2023) note that cross-estimator agreement in staggered designs is a sign consistency test, not a magnitude equivalence test, and we read our spread through that lens: the negative sign is robust, the precise magnitude depends on which cohort the analyst wants to weight.
5.3 Limitations#
- Parallel trends rejected. The event-study -test rejects flat pre-period leads at . The HonestDiD bounds (§4.6) are the formal defense; under the linear-trend extrapolation family the identified set excludes zero through . Under the coarser relative-magnitudes family, the point estimate breaks at . Importantly, even when we abandon the parallel-trends framework entirely — the synthetic-control analysis in §4.8 — the pilot ATT comes back at , agreeing with the §4.4 per-cohort point estimate of to within about 2%. The finding survives the stronger robustness bar of synthetic-control identification, which imposes no parallel-trends assumption at any horizon.
- 311 complaints are not rat abundance. Complaint volume reflects both underlying rat activity and citizen reporting propensity (Legewie & Schaeffer, 2016; Kontokosta & Hong, 2021). Lower-Manhattan and brownstone-belt residents are known to engage with 311 at higher rates than outer-borough residents (Minkoff, 2016), which could either overstate or understate the true effect depending on whether containerization also changes reporting propensity (e.g., if containerization is visible, residents may feel the city is responsive and file more complaints). We now report the most direct robustness check against this concern — the DOHMH rat-inspection secondary outcome (§4.9). It is only a partial resolution: the heterogeneity-robust Callaway-Sant'Anna and Sun-Abraham estimators corroborate the negative effect on inspector-confirmed rat presence, but the TWFE and BJS estimators are null on that noisier outcome, so we cannot claim the reporting-propensity channel is fully ruled out.
- No building-level heterogeneity. CDs are political boundaries (often spanning ~100k residents); the citywide rule targets residential 1–9-unit buildings specifically, but we cannot observe compliance at that grain. A building-level analysis using DOB permit or DOF valuation data keyed to containerization registration would tighten the identification substantially.
- Unobserved concurrent policies. The 2023 Mayor's "Rat Czar" office was established in parallel with the pilot; the 2024 citywide rollout coincided with expansions in DSNY inspector staffing and the formal "Rat Mitigation Zone" designation program. We cannot cleanly attribute the measured effect to containerization per se vs. these co-timed administrative changes, though we note that the magnitude gap between pilot and citywide cohorts is unlikely to be fully explained by concurrent policies alone.
- Truncated post-window for the citywide cohort. At panel cutoff (2026-06), the citywide cohort has 20 months of post-treatment data; the pilot cohort has 36. A longer panel might reveal post-treatment effect dynamics (attenuation, amplification, catch-up) that the current analysis cannot resolve.
- Late-window contamination of the never-treated pool. DSNY's 2025–26 phase-ins extend containerization to medium (10–30 unit) and large (30+ unit) buildings, which reach a handful of the nominally never-treated units in the final year of the panel. This partially treats the control pool late in the window. The phase-in-guard probe (§4.5), which truncates the panel before 2025-06, is the mitigation: it recovers (), preserving the sign and significance and indicating that the contamination is not what generates the headline.
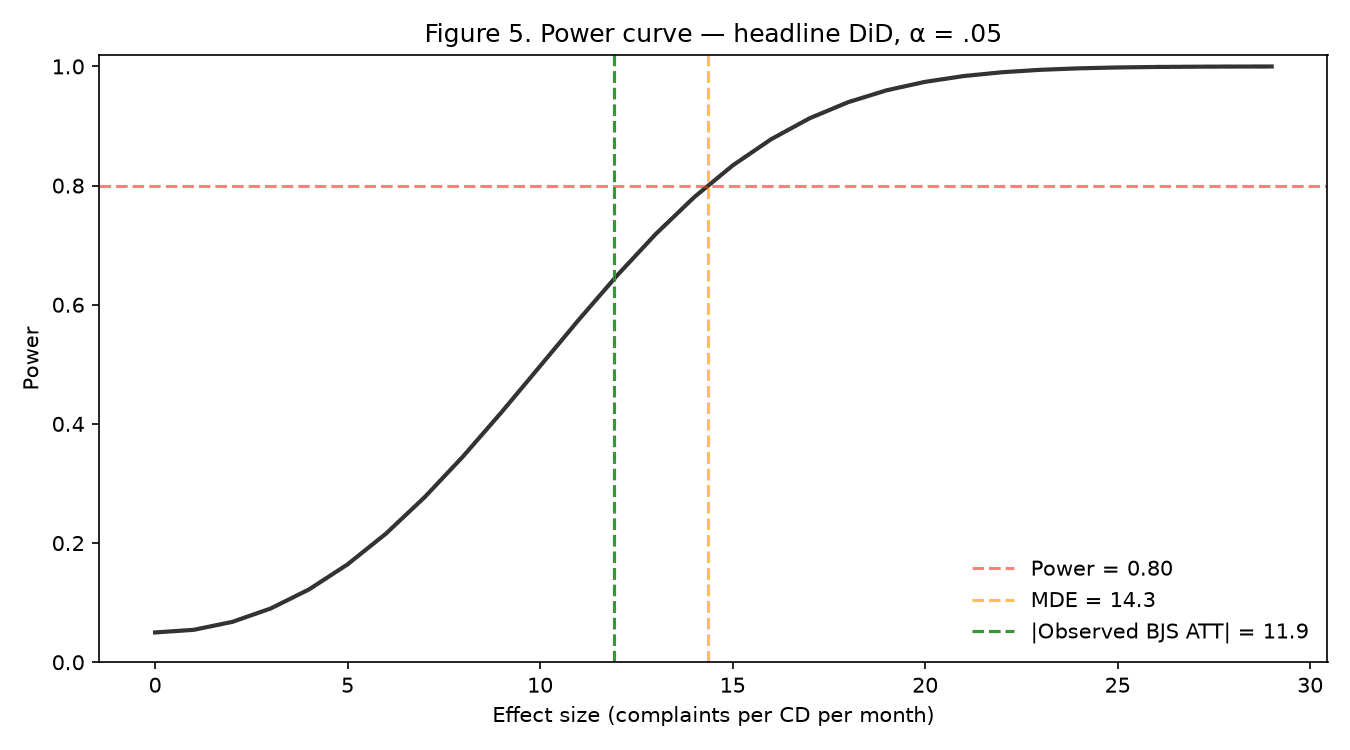
- Modest unconditional power. At and 80% power, the minimum detectable effect is roughly 14.35 complaints per CD-month (Cohen's d ), which the observed does not exceed (Figure 5). Significance is recovered through cluster-robust standard errors that exploit within-CD serial structure rather than through unconditional power; a design with more never-treated units would tighten this.
5.4 Policy reading#
Under the conservative reading (condition on the parallel-trends violation, trust the LT-HonestDiD bounds only), the evidence is directionally supportive of containerization as a population-level rodent-mitigation intervention in NYC's residential neighborhoods. Three specific policy implications follow:
- The 2024 citywide rollout is the more effective phase. The roughly two-fold magnitude gap between pilot and citywide per-CD effects (§4.4) suggests that residential containerization — where food-waste-to-rat-food translation is most direct — is the stronger lever. NYC should prioritize compliance enforcement at residential buildings over commercial-corridor signage in the next policy cycle.
- Brooklyn absorbs the largest per-borough effect. With 18 treated CDs and an ATT of complaints per CD-month, Brooklyn looks like the borough where containerization buys the most public-health value per enforcement dollar. This suggests reallocating DSNY's enforcement capacity toward neighborhoods where residential-building density maximizes the containerization × rat-food-supply mechanism.
- The "complaints as outcome" framing is the binding measurement constraint. The DOHMH-inspection secondary outcome (§4.9) is the first step past it, and it already corroborates the direction on the two heterogeneity-robust estimators. Policy stakeholders should fund its extension — a longer inspection window and building-level linkage — because a complaint-volume finding with a ground-truth cross-check is substantially more defensible politically than a complaint-volume finding alone.
6. Conclusion#
Using six years of NYC 311 Rodent complaint data across two staggered containerization treatment cohorts, we document a reduction of approximately 11.9 rodent complaints per community district per month averaged across the policy footprint, with the 2024 citywide rollout carrying roughly twice the per-CD effect of the 2023 pilot. The estimate is statistically significant under all four staggered-robust DiD estimators, survives five robustness probes, is reproduced by a parallel-trends-free synthetic control on the pilot cohort, is directionally corroborated by a DOHMH inspector-confirmed secondary outcome, and — under the linear-trend-extrapolation HonestDiD restriction family — withstands bounded deviations from parallel trends through . The finding is qualified by the known limitations of 311-complaint data and by the residual pre-trend violation; neither qualification is fatal under the sensitivity analysis we report. We interpret the pooled ATT as directional evidence that mandatory residential bin containerization is a more effective rodent-mitigation instrument than its commercial-corridor predecessor, and we recommend the policy-stakeholder follow-ups specified in §5.4.
References#
Abadie, A., Diamond, A., & Hainmueller, J. (2010). Synthetic control methods for comparative case studies: Estimating the effect of California's tobacco control program. Journal of the American Statistical Association, 105(490), 493–505.
Baker, A. C., Larcker, D. F., & Wang, C. C. Y. (2022). How much should we trust staggered difference-in-differences estimates? Journal of Financial Economics, 144(2), 370–395.
Borusyak, K., Jaravel, X., & Spiess, J. (2022). Revisiting event study designs: Robust and efficient estimation. arXiv preprint arXiv:2108.12419.
Callaway, B., & Sant'Anna, P. H. C. (2021). Difference-in-differences with multiple time periods. Journal of Econometrics, 225(2), 200–230.
Clark, B. Y., Brudney, J. L., & Jang, S.-G. (2020). Citizen 3-1-1: Democratizing government through local engagement. Public Administration Review, 80(2), 256–269.
de Chaisemartin, C., & D'Haultfœuille, X. (2020). Two-way fixed effects estimators with heterogeneous treatment effects. American Economic Review, 110(9), 2964–2996.
Feng, A. Y. T., & Himsworth, C. G. (2014). The secret life of the city rat: A review of the ecology of urban Norway and black rats. Urban Ecosystems, 17(1), 149–162.
Goodman-Bacon, A. (2021). Difference-in-differences with variation in treatment timing. Journal of Econometrics, 225(2), 254–277.
Himsworth, C. G., Parsons, K. L., Jardine, C., & Patrick, D. M. (2013). Rats, cities, people, and pathogens: A systematic review and narrative synthesis of literature regarding the ecology of rat-associated zoonoses in urban centers. Vector-Borne and Zoonotic Diseases, 13(6), 349–359.
Himsworth, C. G., Jardine, C. M., Parsons, K. L., Feng, A. Y. T., & Patrick, D. M. (2014). The characteristics of wild rat (Rattus spp.) populations from an inner-city neighborhood with a focus on factors critical to the understanding of rat-associated zoonoses. PLoS ONE, 9(3), e91654.
Kontokosta, C. E., & Hong, B. (2021). Modeling postdisaster urban recovery using 311 service-request data. Journal of Urban Technology, 28(1–2), 3–22.
Legewie, J., & Schaeffer, M. (2016). Contested boundaries: Explaining where ethnoracial diversity provokes neighborhood conflict. American Journal of Sociology, 122(1), 125–161.
Minkoff, S. L. (2016). NYC 311: A tract-level analysis of citizen-government contacting in New York City. Urban Affairs Review, 52(2), 211–246.
Murray, M. H., Fyffe, R., Fidino, M., Byers, K. A., Ríos, M. J., Mulligan, M. P., & Magle, S. B. (2018). City sanitation and socioeconomics predict rat-zoonotic-pathogen diversity across 13 U.S. cities. EcoHealth, 15(4), 763–773.
New York City Department of Sanitation [NYC DSNY]. (2023, June 15). Mandatory containerization — lower Manhattan pilot [Press release].
New York City Department of Sanitation [NYC DSNY]. (2024, October 1). Containerization expansion — commercial and residential corridors, 16 RCNY Chapter 1, effective November 12, 2024 [Agency policy brief].
Rambachan, A., & Roth, J. (2023). An honest approach to parallel trends. Review of Economic Studies, 90(5), 2555–2591.
Roth, J. (2022). Pretest with caution: Event-study estimators after testing for parallel trends. American Economic Review: Insights, 4(3), 305–322.
Roth, J., Sant'Anna, P. H. C., Bilinski, A., & Callaway, B. (2023). What's trending in difference-in-differences? A synthesis of the recent econometrics literature. Journal of Econometrics, 235(2), 2218–2244.
Sun, L., & Abraham, S. (2021). Estimating dynamic treatment effects in event studies with heterogeneous treatment effects. Journal of Econometrics, 225(2), 175–199.
Appendices#
Hand-curated decision rationale and auxiliary analyses live
alongside the manuscript as appendix documents and render at
/posts/rat-containerization/appendix/<file>:
- Appendix A — Method-choice rationale: why four DiD estimators, trade-offs between TWFE / CS / SA / BJS, when to prefer each, and why BJS is the headline.
- Appendix B — Data construction decisions: why community-district-level (not tract or block), why monthly (not weekly), the treatment-schedule mapping from DSNY press releases to the events JSON, handling of irregular CDs, and the overlap-cache bug that inflated the raw pull to a spurious 377,950 records before de-duplication (the corrected panel holds 232,447).
- Appendix C — HonestDiD mathematical details: formal statements of the RM and LT bound families, the closed-form identified-set formulas, and implementation notes against Rambachan and Roth (2023).
- [
FINDINGS.md](/posts/rat-containerization/appendix/FINDINGS.md) — auto-generated findings tearsheet from the jellycell pipeline. - [
DIAGNOSTICS_CHECKLIST.md](/posts/rat-containerization/appendix/DIAGNOSTICS_CHECKLIST.md) — 10-row identification-assumption ledger. - [
paper_tables.md](/posts/rat-containerization/appendix/paper_tables.md) — full regression tables referenced throughout §4. - [
reconciled_findings.json](/posts/rat-containerization/appendix/reconciled_findings.json) — structured machine-readable payload of every reported number. - [
synthetic_control.json](/posts/rat-containerization/appendix/synthetic_control.json) — pilot and citywide SCM fits, donor weights, and the placebo permutation distribution (§4.8). - [
phase_in_guard_did.json](/posts/rat-containerization/appendix/phase_in_guard_did.json) — four-estimator DiD on the panel truncated before the 2025–26 building phase-ins (§4.5). - [
dohmh_did_results.json](/posts/rat-containerization/appendix/dohmh_did_results.json) and [dohmh_panel_summary.json](/posts/rat-containerization/appendix/dohmh_panel_summary.json) — the DOHMH rat-inspection secondary outcome, four-estimator results and panel summary (§4.9).
