nyc311
stable311 complaint analysis — SDK, CLI, and a factor-factory adapter
v1.0.3Released 2026-04-21·Pythonpip install "nyc311[all]"
What It Is#
nyc311 is a typed Python toolkit for turning NYC 311 service-request data into reproducible complaint-intelligence outputs. It pairs a CLI with a composable SDK so the same workflow runs in batch jobs, scripts, notebooks, and downstream packages.
Why It Matters#
311 records are a strong public signal for neighborhood quality of life, but usable detail sits in short descriptor text and inconsistent geography fields. This package makes that pipeline explicit, testable, and exportable for analysis, reporting, and mapping — and, as of 1.0, hands off cleanly to factor-factory for the causal / econometric second mile.
What Ships in 1.0#
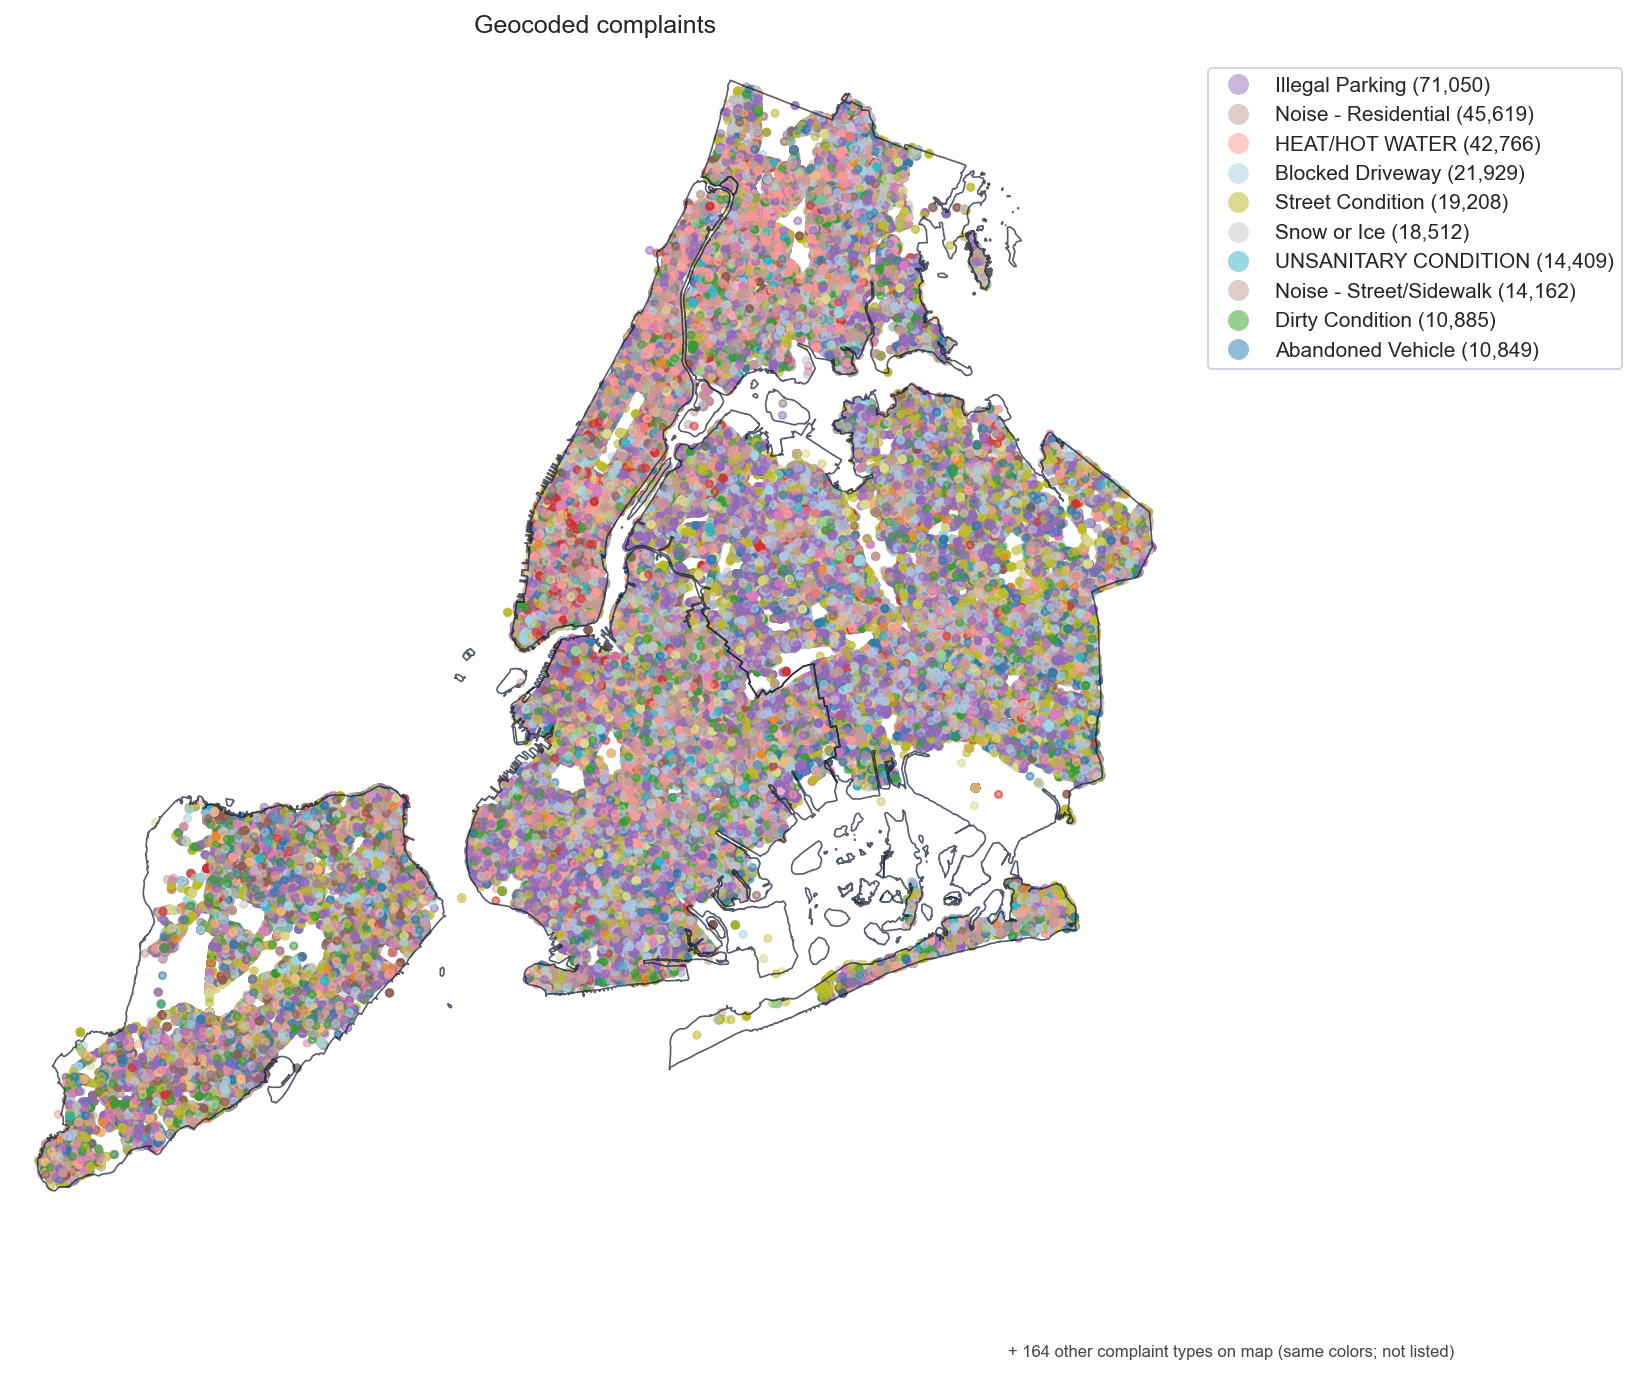
Core pipeline — load from local CSV or the live Socrata API, topic-label by keyword rules across nine high-volume complaint types, aggregate by borough or community district, and export CSV tables, boundary-backed GeoJSON, and markdown report cards.
factor-factory bridge (new in 1.0) — PanelDataset.to_factor_factory_panel() produces a ready-to-fit factor_factory.tidy.Panel; Pipeline.as_factor_factory_estimate(family="did", method="twfe", ...) dispatches across 17 engine families (DiD, RDD, SCM, spatial, inequality, changepoint, STL).
Statistical modeling — interrupted-time-series (ITS), PELT changepoints, STL decomposition, Moran's I / LISA spatial autocorrelation, panel fixed/random-effects regressions, synthetic control, staggered difference-in-differences (TWFE, Callaway-Sant'Anna, Sun-Abraham, Borusyak-Jaravel-Spiess), event-study plots, and RDD. Spatial econometrics include spatial lag/error models.
Equity analysis — Oaxaca-Blinder decomposition, Theil index, reporting-rate adjustment, and latent reporting-bias EM estimation.
Factor pipeline — domain-specific factors (ComplaintVolumeFactor, ResponseRateFactor, TopicConcentrationFactor, EquityGapFactor, SpatialLagFactor) via nyc311.factors.
Temporal infrastructure — balanced panel datasets, treatment-event modeling, and inverse-distance spatial weights via nyc311.temporal.
SDK namespaces: models, io, analysis, geographies, export, pipeline, samples, factors, temporal, stats, presets, and optional dataframes, spatial, plotting, tearsheets, science.
Install extras: pip install "nyc311[all]", [dataframes], [spatial], [plotting], [tearsheets], [science], [stats], or [bayes] (BYM2 via PyMC).
Ecosystem Fit#
nyc311.geographies is the 311-facing layer over nyc-geo-toolkit. The factor-factory adapter is the canonical path for causal inference on 311 panels. Downstream case studies — Rat Containerization and Resolution Equity — live in the blaise-website monorepo and are reproducible via pnpm showcase:run against live Socrata fetches.
The examples/about-the-data folder walks the public datasets, column expectations, and how the package interprets them.
Related Posts
Did NYC's trash-bin containerization reduce rats? Staggered DiD across the 2023 pilot and 2024 citywide rollout finds roughly 12 fewer 311 rat complaints per neighborhood per month, corroborated by DOHMH inspections.
Are NYC 311 noise complaints resolved equitably across demographic geography? A community-board panel finds the Bronx resolves ~65 hours faster than Manhattan, with ~91% of the gap sitting within boroughs.
